
Last year the S&P 500 delivered a whopping 25% annual return, continuing its momentum from 2023 and marking its best two-year stretch since 1997–1998. Other major asset classes, modest by comparison, also delivered positive returns in a year when prominent economists had predicted a recession:

Cash - 90-day T-bill; U.S. Aggregate Bonds - Bloomberg US Aggregate Bond Index; Real Estate - FTSE EPRA Nareit Developed REIT Index; Emerging Markets - MSCI Emerging Markets; High Yield Bonds - Bloomberg High Yield Bond Index; U.S. Small Cap - Russell 2000; International Equities - MSCI World ex USA; U.S. Large Cap - S&P 500
Several market sectors such as financials and communication services contributed to the rally, but the S&P 500’s performance was driven largely by the “Magnificent Seven” mega-cap technology stocks – Alphabet, Amazon, Apple, Meta Platforms, Microsoft, Nvidia, and Tesla. Collectively, they contributed over 53% of the index's total return, with Nvidia alone contributing 21% thanks to an AI-fueled rally and the company’s dominance in high-performance computing chips.
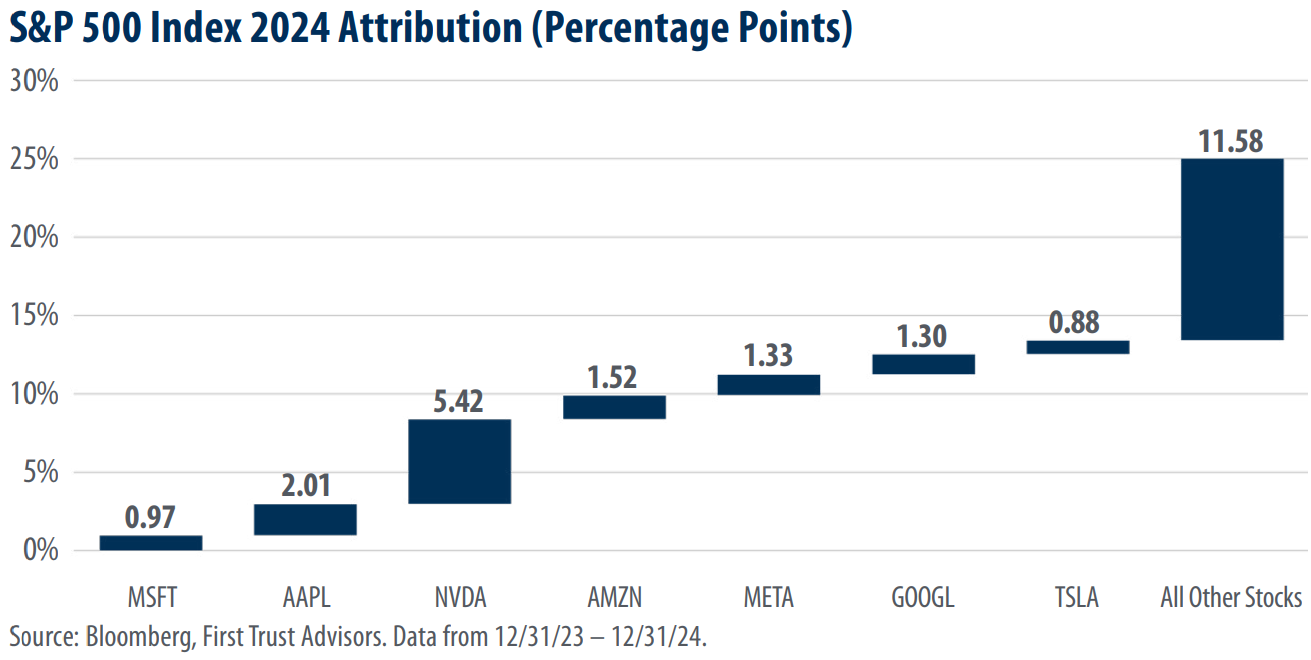
Source: FTPortfolios
That’s an astounding level of influence over a market index designed to reflect the broad U.S. economy through the stock performance of its 500 leading companies.
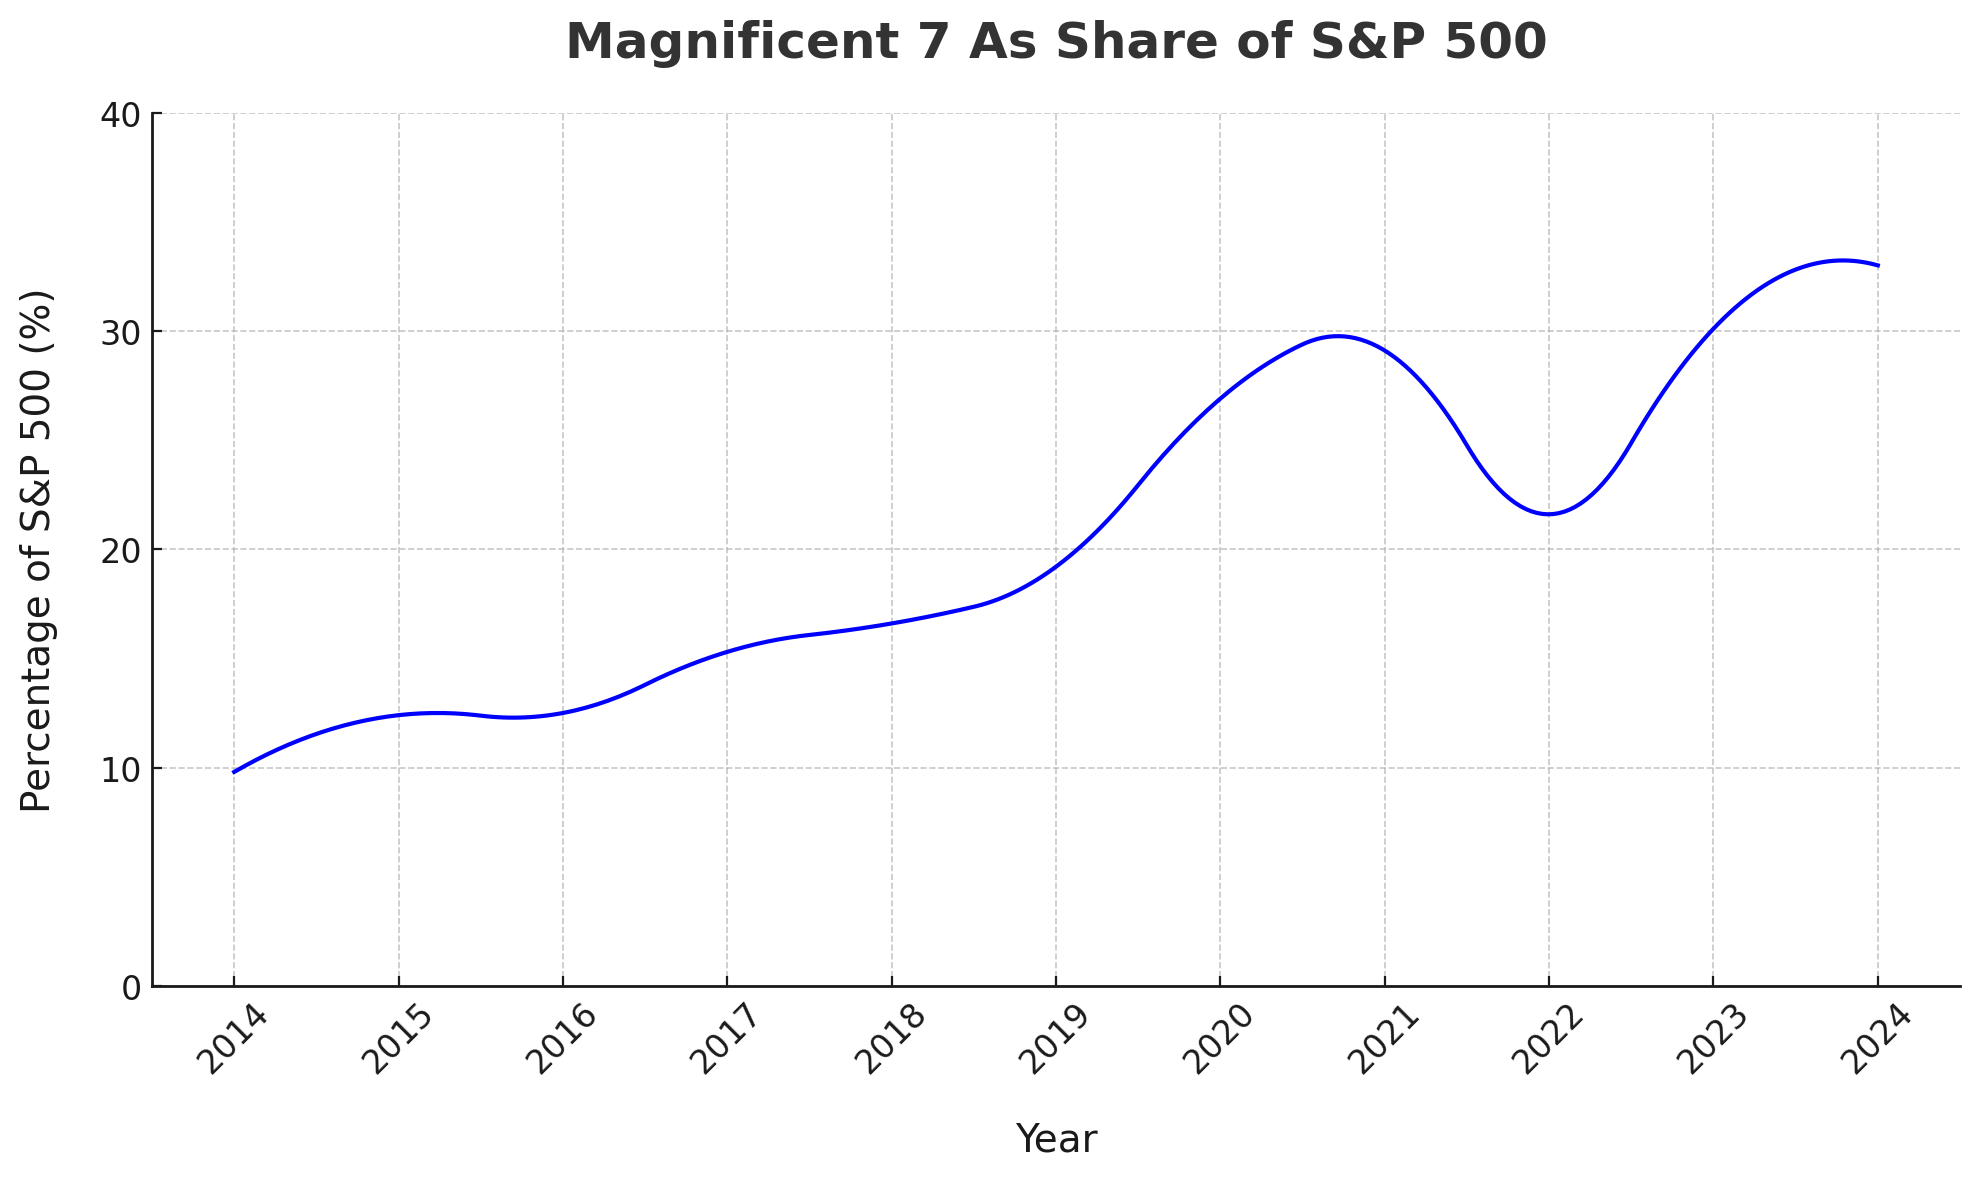
It also represents a sea-change from a decade ago when the Magnificent Seven constituted only 10% of the S&P 500 Index versus the 33% of the index value it represents today:
“Who cares?” an investor enjoying yesterday’s returns may say. “It’s a new world now, tech is eating entire industries, why shouldn’t it eat the index, too?”
Perhaps, but we’ve seen similar patterns of stock concentration in the Index before: in the 1970s with the “Nifty Fifty” stocks, household names promoted as can’t-lose propositions, and a generation later with large “Dot Com” stocks representing the New Economy.
Each time investor enthusiasm for a few market leaders was followed by sharp market declines as sentiment reversed:

Source: SilvercrestGroup
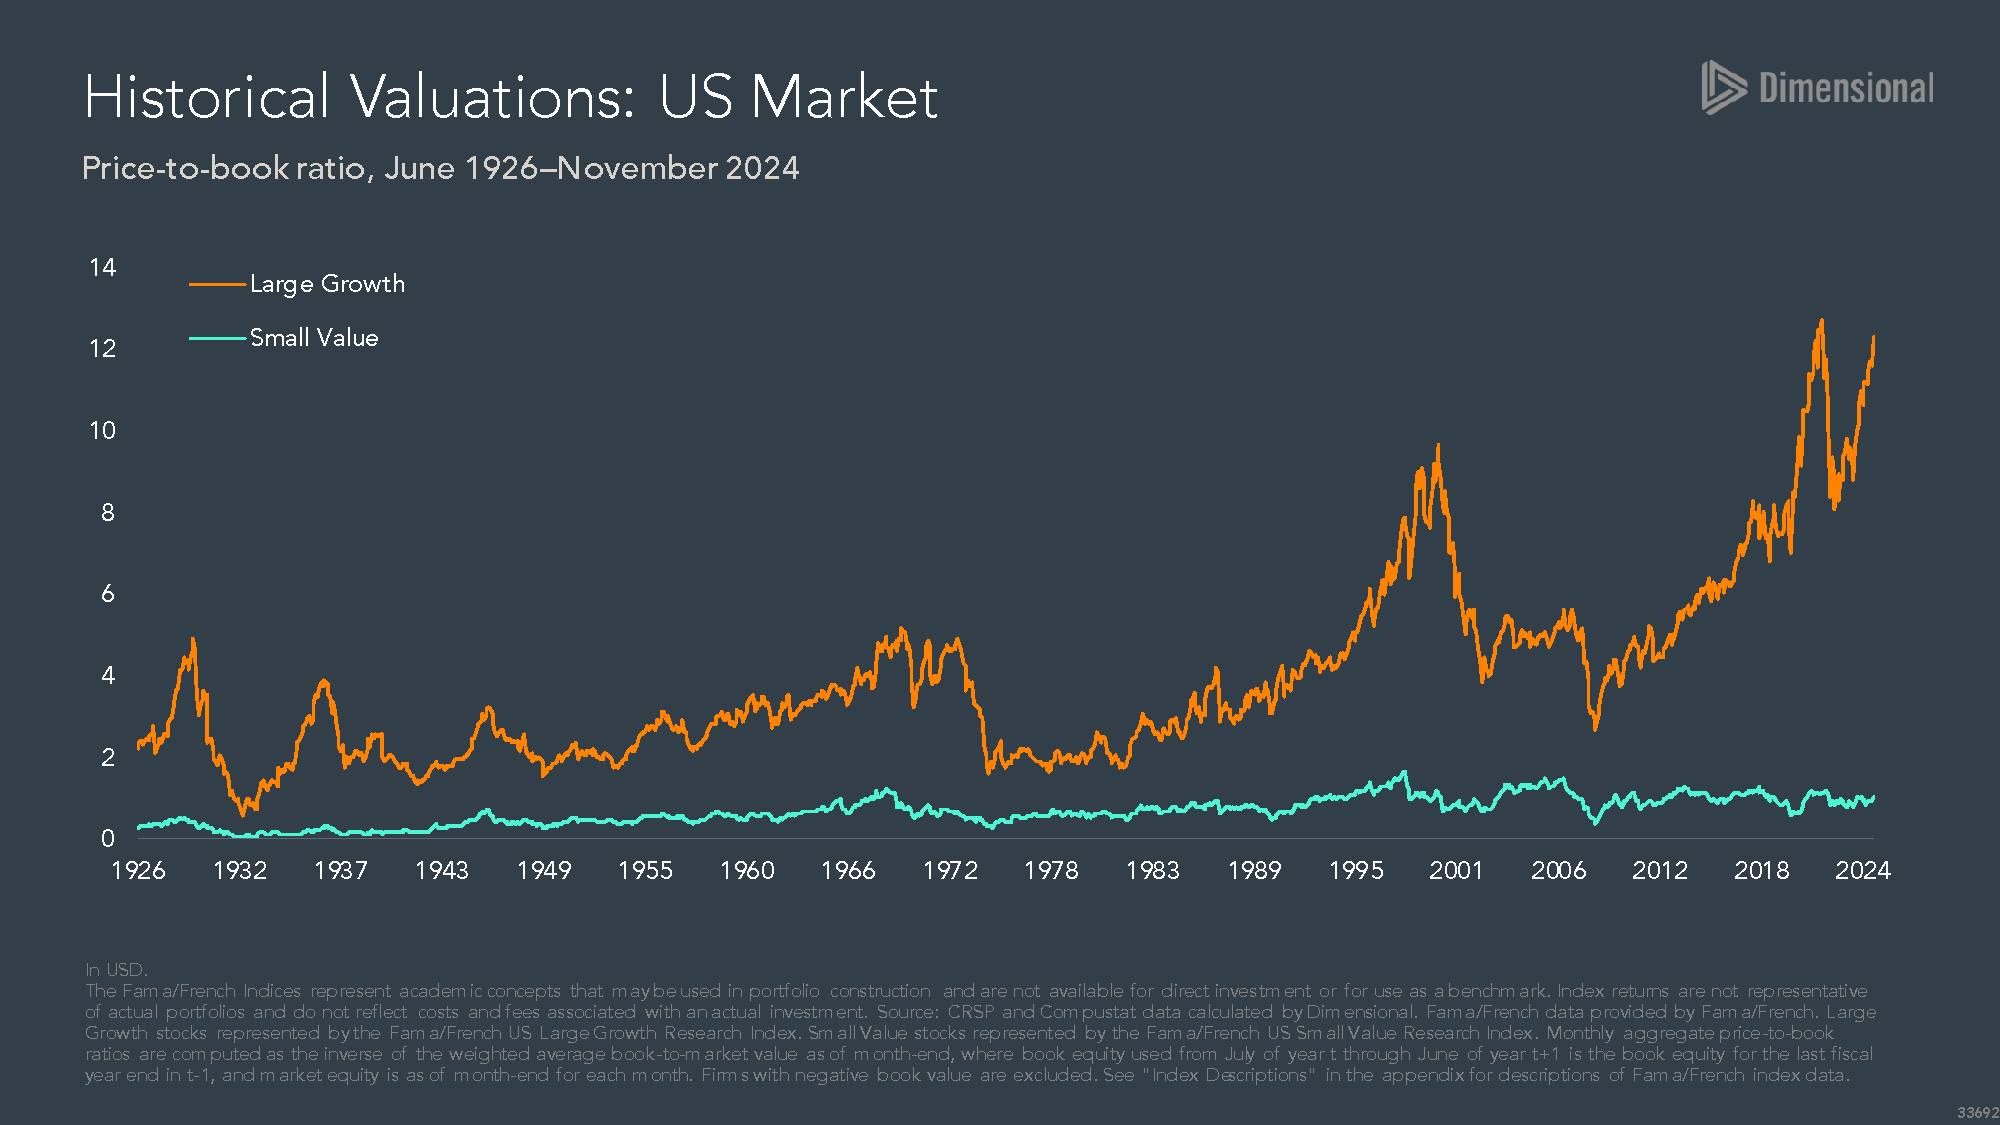
It’s impossible to know how long the S&P 500 will continue to exceed the expectations baked into its constituents’ stock prices. All we really know is that expectations for the large growth companies comprising most of the Index are currently high compared to other types of stocks – for example, less-glamorous small value stocks:
The uncertainty about what comes next, of course, is the chief argument for diversifying investment bets beyond the S&P 500 Index. This focus on risk-management, though, means moving to a different neighborhood in terms of potential upside.
Investors who hedged their bets with a traditional portfolio of 60% U.S. S&P 500 Index and 40% U.S. bonds such as the Vanguard Balanced Index Fund earned about 14% last year. Those who diversified their 60% stock allocation further into other types of U.S. and non-U.S. stocks similar to the Vanguard Vanguard STAR FundFund earned about 9%.
These are respectable returns – 14% is double digits; 9% is nearly the long-term U.S. stock average of 10%. Nevertheless, comparing them to the S&P 500, investors may understandably wonder, Do we really need all this diversification?
If an investor knows which handful of stocks will replicate the results of the Magnificent Seven going forward, they absolutely should not dilute their portfolio with anything but these top performers. After all, an investor could have more than doubled the return of the S&P 500 Index last year by investing only in an ETF holding the Magnificent Seven:

Why stop there? They could have earned a stunning 171% return if they’d invested solely in Nvidia, ditching the other six “laggards” in the Magnificent Seven, each of which trailed Nvidia by more than 100%.
This is the perennial temptation with investing and why sensible approaches to risk management often get tossed, typically at the worst possible moment, into the bin with weight-loss and exercise goals. To resist temptation, it can help to remember past examples of investor exuberance that quickly changed.
Another chip manufacturer, Intel, was once one of the brightest stars in the S&P 500 Index, its “Intel Inside” campaign in the early 1990s making it a household name. Recently, a series of strategic missteps caught up with the stock, which dropped 60% over the past twelve months and left the company’s existence in question.
We saw this, too, on a country level with Japan in the 1980s. At the end of the decade, the Japanese stock market represented nearly 50% of the world’s stock market, and everyone was trying to figure out the secret to Japanese world dominance. Was it the “six sigma” management philosophy? Was it the exercises that Japanese employees famously did as a group each day before work? Then, overnight, Japan’s stock market crashed and never recovered, wiping out thousands of Japanese investors who could see no reason to invest anywhere else. Today, Japan’s publicly traded stocks represent barely more than 5% of the world market.
Okay, a prudent investor may reluctantly agree, but how long do I have to wait for all this diversification to pay off?
That’s the trillion-dollar question, and the best answer is ultimately dissatisfying: probably a little longer than you think you can. Yet this is one of the surest, if elusive, paths to long-term investment success for most investors.